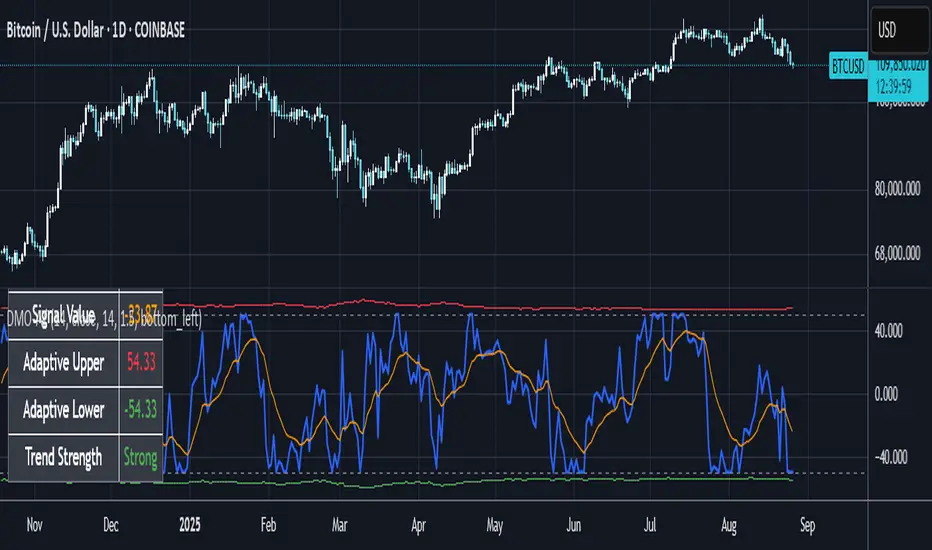
CCI Breakout TraderWorks well on Bitcoin or most altcoins on a 15min chart or higher.
What is this exactly?
This is an indicator that uses horizontal RSI + EMA lines with a CCI line on top of it to provide optimal entry and exit positions for trading. There is also a breakout indicator based on the width of Bollinger Bands.
How to use:
If the blue stream passes upwards on the red heading to the white - it's heading towards a good BUY signal. To be safe you wait until it passes above the white line, then BUY LONG. Another signal to buy long is when the blue stream passes above the white and green lines.
Selling is essentially the opposite, if the blue stream is passing down from the green or white lines, then it's time to sell and exit your trade.
If you need help knowing when to enter and exit a trade the indicator will draw a grey candle on your chart to signal it's time to exit a long trade and it will draw a purple candle when it's time to enter a long.
--
Breakout alert:
If you see a green vertical bar it's a warning that there is a potential breakout in price coming for whichever coin you are looking at. The price breakout could go either direction, so make sure you watch the blue stream.
--
Important tips:
The direction of the green/white/red lines are important - if they are heading down that means it might not be the best time to enter your trade, even if the blue stream crosses up on the red and/or white lines.
The colored horizontal lines are there to let you know if the blue stream is near the bottom of those lines (anywhere from hline 15 to 50) and heading upwards, you will more likely have a longer positive trade. If the blue stream is above 60 hline and it looks like a good trade (passing up on the red and white lines), expect to have a shorter trade.
I use this for swing trading various crypto currencies, once you learn how to read it, you can catch amazing uptrends really early and you can exit trades before some big drops happen.
Поиск скриптов по запросу "swing trading"
Ripster EMA CloudsEMA Cloud By Ripster
EMA Cloud System is a Trading System Invented by Ripster where areas are shaded between two desired EMAs. The concept implies the EMA cloud area serves as support or resistance for Intraday & Swing Trading. This can be utilized effectively on 10 Min for day trading and 1Hr/Daily for Swings. Ripster himself utilizes various combinations of the 5-12, 34-50, 8-9, 20-21 EMA clouds but the possibilities are endless to find what works best for you.
“Ideally, 5-12 or 5-13 EMA cloud acts as a fluid trendline for day trades. 8-9 EMA Clouds can be used as pullback Levels –(optional). Additionally, a high level price over or under 34-50 EMA clouds confirms either bullish or bearish bias on the price action for any timeframe” – Ripster
Medium Term Weighted Stochastic (STPMT) by DGTLa Stochastique Pondérée Moyen Terme (STPMT) , or Mᴇᴅɪᴜᴍ Tᴇʀᴍ Wᴇɪɢʜᴛᴇᴅ Sᴛᴏᴄʜᴀꜱᴛɪᴄꜱ created by Eric Lefort in 1999, a French trader and author of trading books
█ The STPMT indicator is a tool which concerns itself with both the direction and the timing of the market. The STPMT indicator helps the trader with:
The general trend by observing the level around which the indicator oscillates
The changes of direction in the market
The timing to open or close a position by observing the oscillations and by observing the relative position of the STPMT versus its moving average
STPMT Calculation
stpmt = (4,1 * stoch(5, 3) + 2,5 * stoch(14, 3) + stoch(45, 14) + 4 * stoch(75, 20)) / 11.6
Where the first argument of the stoch function representation above is period (length) of K and second argument smoothing period of K. The result series is then plotted as red line and its moving average as blue line. By default disabled gray lines are the components of the STPMT
The oscillations of the STPMT around its moving average define the timing to open a position as crossing of STMP line and moving average line in case when both trends have same direction. The moving average determines the direction.
Long examples
█ Tʜᴇ CYCLE Iɴᴅɪᴄᴀᴛᴏʀ is derived from the STPMT. It is
cycle = stpmt – stpmt moving average
It is indicates more clearly all buy and sell opportunities. On the other hand it does not give any information on market direction. The Cycle indicator is a great help in timing as it allows the trader to more easily see the median length of an oscillation around the average point. In this way the traders can simply use the time axis to identify both a favorable price and a favorable moment. The Cycle Indicator is presented as histogram
The Lefort indicators are not a trading strategy. They are tools for different purposes which can be combined and which can serve for trading all instruments (stocks, market indices, forex, commodities…) in a variety of time frames. Hence they can be used for both day trading and swing trading.
👉 For whom that would like simple version of the Cycle indicator on top of the main price chart with signals as presented below.
Please note that in the following code STMP moving average direction is not considered and will plot signals regardless of the direction of STMP moving average. It is not a non-repainting version too.
here is pine code for the overlay version
// © dgtrd
//@version=4
study("Medium Term Weighted Stochastic (STPMT) by DGT", "STPMT ʙʏ DGT ☼☾", true, format.price, 2, resolution="")
i_maLen = input(9 , "Stoch MA Length", minval=1)
i_periodK1 = input(5 , "K1" , minval=1)
i_smoothK1 = input(3 , "Smooth K1", minval=1)
i_weightK1 = input(4.1 , "Weight K1", minval=1, step=.1)
i_periodK2 = input(14 , "K2" , minval=1)
i_smoothK2 = input(3 , "Smooth K2", minval=1)
i_weightK2 = input(2.5 , "Weight K2", minval=1, step=.1)
i_periodK3 = input(45 , "K3" , minval=1)
i_smoothK3 = input(14 , "Smooth K3", minval=1)
i_weightK3 = input(1. , "Weight K3", minval=1, step=.1)
i_periodK4 = input(75 , "K4" , minval=1)
i_smoothK4 = input(20 , "Smooth K4", minval=1)
i_weightK4 = input(4. , "Weight K4", minval=1, step=.1)
i_data = input(false, "Components of the STPMT")
//------------------------------------------------------------------------------
// stochastic function
f_stoch(_periodK, _smoothK) => sma(stoch(close, high, low, _periodK), _smoothK)
//------------------------------------------------------------------------------
// calculations
// La Stochastique Pondérée Moyen Terme (STPMT) or Medium Term Weighted Stochastics calculation
stpmt = (i_weightK1 * f_stoch(i_periodK1, i_smoothK1) + i_weightK2 * f_stoch(i_periodK2, i_smoothK2) + i_weightK3 * f_stoch(i_periodK3, i_smoothK3) + i_weightK4 * f_stoch(i_periodK4, i_smoothK4)) / (i_weightK1 + i_weightK2 + i_weightK3 + i_weightK4)
stpmt_ma = sma(stpmt, i_maLen) // STPMT Moving Average
cycle = stpmt - stpmt_ma // Cycle Indicator
//------------------------------------------------------------------------------
// plotting
plotarrow(change(sign(cycle)), "STPMT Signals", color.green, color.red, 0, maxheight=41)
alertcondition(cross(cycle, 0), title="Trading Opportunity", message="STPMT Cycle : Probable Trade Opportunity\n{{exchange}}:{{ticker}}->\nPrice = {{close}},\nTime = {{time}}")
Swing Reversal IndicatorSwing Reversal Indicator was meant to help identify pivot points on the chart which indicate momentum to buy and sell. The indicator uses 3 main questions to help plot the points:
Criteria
Did price take out yesterday's high or low?
Is today's range bigger than yesterday? (Indicates activity in price)
Is the close in the upper/lower portion of the candle? Thus, indicating momentum in that direction
This indicator was built to help me find pivot points for directional options trading however can be used for equities and forex swing trading and other strategies. Used in conjunction with a BB extreme can provide good setups.
Alerts are available for both the long and the short positions and the indicator will repaint as price moves.
The character Plotted can be changed in the settings
The size of the candle area can be changed as well if you want to tighten/loosen the trigger points based on the third question above.
Parabolic SAR Swing strategy GBP JPY Daily timeframeToday I bring you a new strategy thats made of parabolic sar. It has optmized values for GBPJPY Daily timeframe chart.
It also has a time period selection, in order to see how it behave between selected years.
The strategy behind it is simple :
We have an uptrend , (the psar is below our candles) we go long. We exit when our candle crosses the psar value.
The same applies for downtrend(the psar is above our candles), where we go short. We exit when our candle cross the psar value.
Among the basic indicators, it looks like PSAR is one of the best canditates for swing trading.
If you have any questions, please let me know.
Ultimate VWAP Bands- Ultimate VWAP Bands is a script that helps to decide and further clarify areas of oversold and overbought conditions.
- For example, when the price is in the lowest band it is extremely oversold relative to the VWAP . Hence it should be considered a good place to buy with a high risk to reward payoff.
- Each band is set at a fixed offset away from the VWAP . The "VWAP Band Multiplier" adjusts this and is a key part of the script. This allows the indicator to be adjusted based on the assets volatility . For example, with Crypto. A multiplier of 1 would be strongly advised. Whilst a multiplier of 0.1-0.25 would be useful for currency pairs.
- This indicator can be used for all manners of trading. However, it is most effective when used for scalping and swing trading.
[blackcat] L2 Swing Oscillator Swing MeterLevel: 2
Background
Swing trading is a type of trading aimed at making short to medium term profits from a trading pair over a period of a few days to several weeks. Swing traders mainly use technical analysis to look for trading opportunities. In addition to analyzing price trends and patterns, these traders can also use fundamental analysis.
Function
L2 Swing Oscillator Swing Meter is an oscillator based on breakouts. Another important feature of it is the swing meter, which confirms the top or bottom's confidence level with different color candles. The higher of the candles stack up, the higher confidence level is indicated.
Key Signal
absolutebot ---> absolute bottom with very high confidence level
ltbot ---> long term bottom with high confidence level
mtbot ---> middle term bottom with moderate confidence level
stbot ---> short term bottom with low confidence level
absolutetop ---> absolute top with very high confidence level
lttop ---> long term top with high confidence level
mttop ---> middle term top with moderate confidence level
sttop ---> short term top with low confidence level
fastline ---> oscillator fast line
slowline ---> oscillator slow line
Pros and Cons
Pros:
1. reconfigurable swing oscillator based on breakouts
2. swing meter can confirm/validate the bottom and top signal
Cons:
1. not appliable with trading pairs without volume information
2. small time frame may not trigger swing meter function
Remarks
This is a simple but very comprehensive technical indicator
Readme
In real life, I am a prolific inventor. I have successfully applied for more than 60 international and regional patents in the past 12 years. But in the past two years or so, I have tried to transfer my creativity to the development of trading strategies. Tradingview is the ideal platform for me. I am selecting and contributing some of the hundreds of scripts to publish in Tradingview community. Welcome everyone to interact with me to discuss these interesting pine scripts.
The scripts posted are categorized into 5 levels according to my efforts or manhours put into these works.
Level 1 : interesting script snippets or distinctive improvement from classic indicators or strategy. Level 1 scripts can usually appear in more complex indicators as a function module or element.
Level 2 : composite indicator/strategy. By selecting or combining several independent or dependent functions or sub indicators in proper way, the composite script exhibits a resonance phenomenon which can filter out noise or fake trading signal to enhance trading confidence level.
Level 3 : comprehensive indicator/strategy. They are simple trading systems based on my strategies. They are commonly containing several or all of entry signal, close signal, stop loss, take profit, re-entry, risk management, and position sizing techniques. Even some interesting fundamental and mass psychological aspects are incorporated.
Level 4 : script snippets or functions that do not disclose source code. Interesting element that can reveal market laws and work as raw material for indicators and strategies. If you find Level 1~2 scripts are helpful, Level 4 is a private version that took me far more efforts to develop.
Level 5 : indicator/strategy that do not disclose source code. private version of Level 3 script with my accumulated script processing skills or a large number of custom functions. I had a private function library built in past two years. Level 5 scripts use many of them to achieve private trading strategy.
L1 Mid-Term Swing Oscillator v1Level: 1
Background
Oscillators are widely used set of technical analysis indicators. They are popular primarily for their ability to alert of a possible trend change before that change manifests itself in price and volume . They should work best in times of sideways markets.
Function
L1 Short-Mid-Long-Term Swing Oscillator puts three terms of oscillators to cover short-term, middle-term and long-term oscillators at the same time. By resonating all these three oscillators, short-term scalping signal and middle term swing signal are disclosed. You can see both short and mid term signal under one indicator which give you more confidence to follow the trend.
Key Signal
I didn't handle the key signals well. I piled up all the useful signals I found, and it is really difficult to classify them one by one. I feel tired when I think about this problem. Therefore, the code of the overall signal is rather confusing, sorry.
Pros and Cons
Pros:
1. Three oscillators are used to cover short, mid, long term oscillations.
2. Short-Mid term resonance can be observed to have higher confidence level.
3. Use single indicator for scalping and swing trading is possible.
Cons:
1. No deep dive into very accurate long and short entries.
2. A trade off between sensitivity and stability may be needed by traders' subjective judge.
Remarks
I enjoyed the fun of put three different oscillator together to cover short, mid, long terms. But how to use them perfectly is really more brainstorming.
Readme
In real life, I am a prolific inventor. I have successfully applied for more than 60 international and regional patents in the past 12 years. But in the past two years or so, I have tried to transfer my creativity to the development of trading strategies. Tradingview is the ideal platform for me. I am selecting and contributing some of the hundreds of scripts to publish in Tradingview community. Welcome everyone to interact with me to discuss these interesting pine scripts.
The scripts posted are categorized into 5 levels according to my efforts or manhours put into these works.
Level 1 : interesting script snippets or distinctive improvement from classic indicators or strategy. Level 1 scripts can usually appear in more complex indicators as a function module or element.
Level 2 : composite indicator/strategy. By selecting or combining several independent or dependent functions or sub indicators in proper way, the composite script exhibits a resonance phenomenon which can filter out noise or fake trading signal to enhance trading confidence level.
Level 3 : comprehensive indicator/strategy. They are simple trading systems based on my strategies. They are commonly containing several or all of entry signal, close signal, stop loss, take profit, re-entry, risk management, and position sizing techniques. Even some interesting fundamental and mass psychological aspects are incorporated.
Level 4 : script snippets or functions that do not disclose source code. Interesting element that can reveal market laws and work as raw material for indicators and strategies. If you find Level 1~2 scripts are helpful, Level 4 is a private version that took me far more efforts to develop.
Level 5 : indicator/strategy that do not disclose source code. private version of Level 3 script with my accumulated script processing skills or a large number of custom functions. I had a private function library built in past two years. Level 5 scripts use many of them to achieve private trading strategy.
Why is it ok to backtest on TradingView from now on!TradingView backtester has bad reputation. For a good reason - it was producing wrong results, and it was clear at first sight how bad they were.
But this has changed. Along with many other improvements in its PineScript coding capabilities, TradingView fixed important bug, which was the main reason for miscalculations. TradingView didn't really speak out about this fix, so let me try :)
Have a look at this short code of a swing trading strategy (PLEASE DON'T FOCUS ON BACKTEST RESULTS ATTACHED HERE - THEY DO NOT MATTER). Sometimes entry condition happens together with closing condition for the already ongoing trade. Example: the condition to close Long entry is the same as a condition to enter Short. And when these two aligned, not only a Long was closed and Short was entered (as intended), but also a second Short was entered, too!!! What's even worse, that second short was not controlled with closing conditions inside strategy.exit() function and it very often lead to losses exceeding whatever was declared in "loss=" parameter. This could not have worked well...
But HOORAY!!! - it has been fixed and won't happen anymore. So together with other improvements - TradingView's backtester and PineScript is now ok to work with on standard candlesticks :)
Yep, no need to code strategies and backtest them on other platforms anymore.
----------------
Having said the above, there are still some pitfalls remaining, which you need to be aware of and avoid:
Don't backtest on HeikenAshi, Renko, Kagi candlesticks. They were not invented with backtesting in mind. There are still using wrong price levels for entries and therefore producing always too good backtesting results. Only standard candlesticks are reliable to backtest on.
Don't use Trailing Stop in your code. TradingView operates only on closed candlesticks, not on tick data and because of that, backtester will always assume price has first reached its favourable extreme (so 'high' when you are in Long trade and 'low' when you are in Short trade) before it starts to pull back. Which is rarely the truth in reality. Therefore strategies using Trailing Stop are also producing too good backtesting results. It is especially well visible on higher timeframe strategies - for some reason your strategy manages to make gains on those huge, fat candlesticks :) But that's not reality.
"when=" inside strategy.exit() does not work as you would intuitively expect. If you want to have logical condition to close your trade (for example - crossover(rsi(close,14),20)) you need to place it inside strategy.close() function. And leave StopLoss + TakeProfit conditions inside strategy.exit() function. Just as in attached code.
If you're working with pyramiding, add "process_orders_on_close=ANY" to your strategy() script header. Default setting ("=FIFO") will first close the trade, which was opened first, not the one which was hit by Stop-Loss condidtion.
----------------
That's it, I guess :) If you are noticing other issues with backtester and would like to share, let everyone know in comments. If the issue is indeed a bug, there is a chance TradingView dev team will hear your voice and take it into account when working on other improvements. Just like they heard about the bug I described above.
P.S. I know for a fact that more improvements in the backtesting area are coming. Some will change the game even for non-coding traders. If you want to be notified quickly and with my comment - gimme "follow".
Investing - Weekly EMA's mapped to Daily ChartWhen there isn't enough time in your day to day-trade, yet you want to utilise all the technical analysis skills you have... why not make a long term investing or swing trading indicator set to help you along the way!
So I did....
When it comes to long term investing and swing trading, I often find the weekly 12/26/52 EMA's do a great job in capturing the main market swings from bull to bear.
However, I like to use the Daily chart to see the candle patterns and shapes with more detail and divergences often show up better on the daily chart.
So I have decided to combine the two!
I have basically taken the EMA 12/26/52 from the weekly and transferred them over to the daily (mathematically they are not exact, but for me they are close enough).
I have also developed a simple scale in / scale out strategy for using these exponential moving averages. It isn't as simple as buying in on each signal, however I use my own special strategy to take advantage of the alerts.
Enjoy!
Complete Trend Trading System [Fhenry0331]This system was designed for the beginner trader to make money swing trading. Your losses will be small and your gains will be mostly large. You will show consistent profit. Period.
The system works on any security you like to trade. I used GBPUSD as an example because of the up swing and down swing it had recently. I tried to put as much information of how the system works in the chart. Hope it helps and is not to cluttered.
I will reiterate how the system works here: Everything is based off of closed price.
Legend
Uptrend: Buy
Green bar: initial start of an uptrend or uptrend continuing. Place order above that bar. If the initial bar does not stray too far from the MVWAP , I will place orders above subsequent bars if no filled occurred.
If initial start of the trend is missed, I will wait for the pullback. A pullback is a close below the MVWAP, and a close above the EMA (Low), RSI is above 50. Orders are placed above the pullback bars with plotted char "B" and also plotted green triangle up. Again orders are placed above those bars. the bars do not notate automatic buys. Don't chase anything. You will miss the initial bar on something because of news or earnings and it rocket up. Just wait, it will pullback. If it doesn't, to hell with it, on to the next.
Take profits: In the indicator you will see "T." That notates to take some profits. It is a suggestion. I was always told to take profits into spikes, as well as you can never lose money if you take profits. Up to you if you want to scale out and take the suggested profits or not.
Exit Completely: In an uptrend, close your entire position on bars colored yellow or red. (Again, closed bars)
In uptrend bars colored orange and black, do nothing, they are just pullback bars. Look for the buy pullback signal, then follow pullback buy rules for an uptrend.
Downtrend: Short
Red bar: initial start of a downtrend or downtrend continuing. Place order below the bar. If the initial bar does not stray too far fro the MVWAP, place orders below subsequent bars.
If initial start on the downtrend is missed, wait for the pullback. A pullback is a close above the MVWAP, and close below the EMA(Low). RSI is below 50. Orders are placed below the pullback bars with the plotted char "S" and also plotted red triangle. Again those bars are not automatic shorts, orders are placed below them. Don't chase anything. Wait for price to come into your plan. The idea FOMO is the stupidest thing ever, how can you miss out on something when it is always there. The market is always there and something will come into your zone. Chill.
"T": same as in uptrend, suggestion to take some profits.
Exit Completely: In a downtrend, close your entire position on bars colored orange or green.
In downtrend you will see bars colored yellow and black, do nothing, they are pullback bars. Look for the pullback short signal and follow pullback short rules.
If you have any questions get at me. Take a look at it on what you trade. Flip it through different securities.
Best of luck in all you do.
P.S. You should not take a trade right before earnings. You should also exit a trade right before earnings.
Binque's Multi-Moving Average Binque's Multi-Moving Average - One indicator with four simple moving average and four exponential moving averages, plus as a bonus a Day High moving average and a Day Low Moving Average.
Simple Moving Average or MA(14), MA(50), MA(100) and MA(200) all in one indicator
Exponential Moving Average or EMA(8), EMA(14), EMA(20) and EMA(33) all in one indicator
Day High Moving Average - Tracks the Daily High versus most moving averages track the daily close.
Day Low Moving Average - Tracks the Daily Low versus most moving average track the daily close.
To Disable moving averages, Set the color to the chart background and then set the length to 1 and uncheck.
I Use the Daily High Moving Average to track upward resistance in a stock movement for Swing Trading.
I Use the Daily Low Moving Average to track my trailing stop in a stock movement for Swing Trading.
Big Snapper Alerts R2.0 by JustUncleLThis is a diversified Binary Option or Scalping Alert indicator originally designed for lower Time Frame Trend or Swing trading. Although you will find it a useful tool for higher time frames as well.
The Alerts are generated by the changing direction of the ColouredMA (HullMA by default), you then have the choice of selecting the Directional filtering on these signals or a Bollinger swing reversal filter.
The filters include:
Type 1 - The three MAs (EMAs 21,55,89 by default) in various combinations or by themselves. When only one directional MA selected then direction filter is given by ColouredMA above(up)/below(down) selected MA. If more than one MA selected the direction is given by MAs being in correct order for trend direction.
Type 2 - The SuperTrend direction is used to filter ColouredMA signals.
Type 3 - Bollinger Band Outside In is used to filter ColouredMA for swing reversals.
Type 4 - No directional filtering, all signals from the ColouredMA are shown.
Notes:
Each Type can be combined with another type to form more complex filtration.
Alerts can also be disabled completely if you just want one indicator with one colouredMA and/or 3xMAs and/or Bollinger Bands and/or SuperTrend painted on the chart.
Warning:
Be aware that combining Bollinger OutsideIn swing filter and a directional filter can be counter productive as they are opposites. So careful consideration is needed when combining Bollinger OutsideIn with any of the directional filters.
Hints:
For Binary Options try ColouredMA = HullMA(13) or HullMA(8) with Type 2 or 3 Filter.
When using Trend filters SuperTrend and/or 3xMA Trend, you will find if price reverses and breaks back through the Big Fat Signal line, then this can be a good reversal trade.
Some explanation about the what Hull Moving average and ideas of how the generated in Big Snapper can be used:
tradingsim.com
forextradingstrategies4u.com
Inspiration from @vdubus
Big Snapper's Bollinger OutsideIn Swing filter in Action:
Colored Volume Bars [LazyBear]Edgar Kraut proposed this simple colored volume bars strategy for swing trading.
This is how the colors are determined:
- If today’s closing price and volume are greater than 'n' days ago, color today’s volume bar green.
- If today’s closing price is greater than 'n' days ago but volume is not, color today’s volume bar blue.
- Similarly, if today’s closing price and volume is less than 'n' days ago, color today’s volume bar orange.
- If today’s closing price is less than 'n' days ago but volume is not, color today’s volume bar red.
Buy the green or blue volume bars, use a 1% trailing stop, and stand aside on red or orange bars.
As you see, this is more for entry confirmation. I have not tested this on any instrument.
You may have to tune the lookback period for your instrument. Default is 10.
More info:
"A color-based system for short-term trading" - www.traders.com
List of all my indicators:
💎DrFX Diamond Algo 💎Diamond Algo - Multi-Feature Trading System
Advanced trading system combining Supertrend signals with multiple confirmation filters, risk management tools, and a comprehensive market analysis dashboard.
═══ CORE FEATURES ═══
• Smart Buy/Sell signals using modified Supertrend algorithm
• Multi-timeframe trend analysis (M1 to D1)
• Support & Resistance zone detection
• Risk management with automatic TP/SL levels (1:1, 2:1, 3:1)
• Real-time market dashboard with key metrics
• Multiple trend cloud overlays for visual confirmation
═══ SIGNAL GENERATION ═══
BUY Signal:
• Supertrend bullish crossover
• Price above SMA filter
• Optional smart signals (EMA 200 confirmation)
SELL Signal:
• Supertrend bearish crossunder
• Price below SMA filter
• Optional smart signals (EMA 200 confirmation)
═══ DASHBOARD COMPONENTS ═══
• Multi-timeframe trend status (8 timeframes)
• Current position indicator
• Market state analysis (Trending/Ranging/No trend)
• Volatility percentage
• Institutional activity monitor
• Trading session tracker (NY/London/Tokyo/Sydney)
• Trend pressure indicator
═══ VISUAL OVERLAYS ═══
• Trend Cloud: Long-term trend visualization
• Trend Follower: Adaptive trend line
• Comulus Cloud: Dual ALMA-based trend zones
• Cirrus Cloud: Short-term trend bands
• Smart Trail: Fibonacci-based trailing stop
• Dynamic trend lines with breakout alerts
═══ RISK MANAGEMENT ═══
• Automatic Stop-Loss placement (ATR-based)
• Three Take-Profit levels with Risk:Reward ratios
• Entry price labeling
• Optional distance and decimal customization
• Visual lines connecting entry to targets
═══ INPUT PARAMETERS ═══
Sensitivity (1-20): Controls signal frequency
Smart Signals Only: Filters for high-probability setups
Bar Coloring: Trend-based or gradient coloring
Dashboard Location/Size: Customizable placement
Multiple overlay toggles for clean charts
═══ BEST PRACTICES ═══
• Lower sensitivity (1-5) for swing trading
• Higher sensitivity (10-20) for scalping
• Enable Smart Signals for conservative approach
• Use dashboard to confirm multi-timeframe alignment
• Monitor volatility % before entering trades
═══ ALERT CONDITIONS ═══
• Buy Alert: Triggered on bullish signal
• Sell Alert: Triggered on bearish signal
• Trend line breakout alerts (automated)
═══ VERSION INFO ═══
Pine Script: v5
Max Labels: 500
Repainting: Minimal (uses confirmed bars for signals)
```
Fisher Transform Trend Navigator [QuantAlgo]🟢 Overview
The Fisher Transform Trend Navigator applies a logarithmic transformation to normalize price data into a Gaussian distribution, then combines this with volatility-adaptive thresholds to create a trend detection system. This mathematical approach helps traders identify high-probability trend changes and reversal points while filtering market noise in the ever-changing volatility conditions.
🟢 How It Works
The indicator's foundation begins with price normalization, where recent price action is scaled to a bounded range between -1 and +1:
highestHigh = ta.highest(priceSource, fisherPeriod)
lowestLow = ta.lowest(priceSource, fisherPeriod)
value1 = highestHigh != lowestLow ? 2 * (priceSource - lowestLow) / (highestHigh - lowestLow) - 1 : 0
value1 := math.max(-0.999, math.min(0.999, value1))
This normalized value then passes through the Fisher Transform calculation, which applies a logarithmic function to convert the data into a Gaussian normal distribution that naturally amplifies price extremes and turning points:
fisherTransform = 0.5 * math.log((1 + value1) / (1 - value1))
smoothedFisher = ta.ema(fisherTransform, fisherSmoothing)
The smoothed Fisher signal is then integrated with an exponential moving average to create a hybrid trend line that balances statistical precision with price-following behavior:
baseTrend = ta.ema(close, basePeriod)
fisherAdjustment = smoothedFisher * fisherSensitivity * close
fisherTrend = baseTrend + fisherAdjustment
To filter out false signals and adapt to market conditions, the system calculates dynamic threshold bands using volatility measurements:
dynamicRange = ta.atr(volatilityPeriod)
threshold = dynamicRange * volatilityMultiplier
upperThreshold = fisherTrend + threshold
lowerThreshold = fisherTrend - threshold
When price momentum pushes through these thresholds, the trend line locks onto the new level and maintains direction until the opposite threshold is breached:
if upperThreshold < trendLine
trendLine := upperThreshold
if lowerThreshold > trendLine
trendLine := lowerThreshold
🟢 Signal Interpretation
Bullish Candles (Green): indicate normalized price distribution favoring bulls with sustained buying momentum = Long/Buy opportunities
Bearish Candles (Red): indicate normalized price distribution favoring bears with sustained selling pressure = Short/Sell opportunities
Upper Band Zone: Area above middle level indicating statistically elevated trend strength with potential overbought conditions approaching mean reversion zones
Lower Band Zone: Area below middle level indicating statistically depressed trend strength with potential oversold conditions approaching mean reversion zones
Built-in Alert System: Automated notifications trigger when bullish or bearish states change, allowing you to act on significant developments without constantly monitoring the charts
Candle Coloring: Optional feature applies trend colors to price bars for visual consistency and clarity
Configuration Presets: Three parameter sets available - Default (balanced settings), Scalping (faster response with higher sensitivity), and Swing Trading (slower response with enhanced smoothing)
Color Customization: Four color schemes including Classic, Aqua, Cosmic, and Custom options for personalized chart aesthetics
VWAP Multi Sessions + EMA + TEMA + PivotThis indicator combines several technical tools in one, designed for both intraday and swing traders to provide a complete view of market dynamics.
- VWAP Multi Sessions: calculates and plots five independent VWAPs, each based on a specific time range. This allows you to better identify value zones and price evolution during different phases of the trading day.
- Moving Averages (EMA): three strategic EMAs (55, 144, and 233 periods) are included to track the broader trend and highlight potential crossovers.
- TEMA (Triple Exponential Moving Average): two TEMAs (144 and 233 periods) offer a more responsive alternative to EMAs, reducing lag while filtering out some market noise.
- Daily Levels: the previous day’s open, close, high, and low are plotted as key support and resistance references.
- Pivot Point (P): also included is the classic daily pivot from the previous session, calculated as (High + Low + Close) / 3, which acts as a central level around which price often gravitates.
In summary, this indicator combines:
- intraday value references (session VWAPs),
- trend indicators (EMA and TEMA),
- and daily reference points (OHLC and Pivot).
It is particularly suited for intraday, scalping, and swing trading strategies, helping traders anticipate potential reaction zones in the market more effectively.
Market Mode Risk IndicatorMarket Mode Risk Indicator v1.1
This custom indicator helps traders gauge market risk sentiment by monitoring Exponential Moving Average (EMA) or Simple Moving Average (SMA) crossovers on key indices like BIST 100 (for Turkish markets), NASDAQ Composite (tech-focused US), or Dow Jones Industrial Average (industrial US). It dynamically categorizes the market into three actionable modes based on the index's position relative to layered MAs, providing a quick visual snapshot without cluttering your chart.
Risk Modes Explained:
RISK OFF (Red): Index closes below the Long MA (default 50 periods) – signals bearish caution; time to tighten stops or reduce exposure.
RISK TEST (Orange): Index above Medium MA1 (21 periods) and Extra Long MA (55 periods), but below Short MA (10 periods) and above Long MA – a transitional "test" phase; watch for confirmation before entering.
RISK ON (Green): Index above all MAs (Short, Medium, Long, Extra Long) – bullish green light; favorable for longs or momentum plays.
How It Works:
The core logic uses boolean checks on the index's close price against user-defined MA lengths. For example:
It pulls live data from your selected index via request.security.
Computes MAs with ternary operators for EMA (ta.ema) or SMA (ta.sma) based on your choice.
Mode detection relies on AND/OR conditions (e.g., aboveShort and aboveMed1 and aboveLong and aboveExtraLong for RISK ON) to filter noise and focus on meaningful shifts.
No lookahead bias – all calculations are historical and real-time compatible. Defaults (10/21/50/55) are inspired by common Fibonacci-inspired periods for balanced sensitivity.
Alerts fire only on mode transitions (e.g., from RISK OFF to ON) to prevent spam, using alertcondition with dynamic messages including price and ticker.
Customization Options:
Index & MA Settings: Switch EMA/SMA; tweak lengths (min 1 period) for your timeframe (e.g., shorter for intraday).
Display: Position the table (top/bottom, left/right); toggle MA values on/off.
Looks: Background/border/text colors, transparency (0-100%) for theme matching.
Built in Pine Script v5 for efficiency – lightweight, no repaints.
Usage Tips:
Add to any stock chart (e.g., GARAN for BIST analysis).
Select your index in settings; refresh chart if switching MA type.
Use on daily/4H timeframes for swing trading; alerts via email/SMS for hands-free monitoring.
Pro Tip: Combine with volume or RSI for confirmation – RISK ON + rising volume = stronger buy signal.
Engulfing Pattern Scanner with RSI FilterEngulfing Pattern Scanner with RSI Filter
This indicator identifies high-probability engulfing patterns using multiple confirmation filters including candle stability, RSI divergence, and price momentum over a specified period.
═══ INDICATOR LOGIC ═══
BUY Signal Generated When:
• Bullish engulfing pattern forms
• Candle stability exceeds threshold (body/wick ratio)
• RSI is below oversold threshold
• Price has decreased over the delta period
• Bar is confirmed (no repainting)
SELL Signal Generated When:
• Bearish engulfing pattern forms
• Candle stability exceeds threshold
• RSI is above overbought threshold
• Price has increased over the delta period
• Bar is confirmed (no repainting)
═══ KEY FEATURES ═══
• Candle Stability Index (0-1): Filters out unstable/noisy candles
• RSI Index (0-100): Confirms momentum conditions
• Candle Delta Length: Defines lookback period for price movement
• Disable Repeating Signals: Removes consecutive same-direction signals
• Multiple visual styles: Text bubbles, triangles, or arrows
• Customizable colors and label sizes
• Built-in alert conditions
═══ INPUT PARAMETERS ═══
Candle Stability Index (0.5 default): Higher values require more decisive candles
RSI Index (50 default): Threshold for overbought/oversold conditions
Candle Delta Length (5 default): Bars to measure price change
Label customization: Size, style, and colors
═══ HOW TO USE ═══
1. Add indicator to chart
2. Adjust technical parameters based on market volatility
3. Set visual preferences for signal display
4. Create alerts using the built-in conditions
5. Higher Candle Stability = fewer but higher quality signals
6. Lower RSI Index = more conservative entry points
═══ BEST PRACTICES ═══
• Use on higher timeframes (4H+) for swing trading
• Combine with support/resistance for confluence
• Test parameters on historical data before live trading
• Consider market conditions when adjusting filters
═══ VERSION INFO ═══
Pine Script: v5
Repainting: No (uses barstate.isconfirmed)
Max Labels: 500
```
MK_OSFT-Momentum Confluence DetectorMOMENTUM CONFLUENCE DETECTOR - Trading Indicator Overview
What This Indicator Does
The Momentum Confluence Detector is a comprehensive Pine Script indicator designed to identify high-probability trading opportunities by detecting momentum bars that align with multiple confluence factors. It combines traditional technical analysis with advanced Smart Money Concepts to filter out noise and highlight the most significant price movements.
CORE FUNCTIONALITY
📊 Momentum Bar Detection Identifies unusual volume and bar size expansion using customizable multipliers
Detects bullish, bearish, and neutral momentum bars based on OHLC relationships
Uses moving averages to establish baseline volume and bar size thresholds
🔄 Multi-Filter Confluence System
The indicator employs up to 5 different filter types to validate momentum signals:
Level Concept Filter - Choose between:
- Support/Resistance Levels : Traditional pivot-based S/R zones with touch counting and break tracking
- Smart Money Concepts : Institutional order flow analysis including Order Blocks, Fair Value Gaps (FVGs), and market structure breaks
Trend Filter : EMA/SMA-based trend direction confirmation with alignment requirements
Breakout Filter : Detects price breakouts beyond recent highs/lows with percentage thresholds
Volatility Filter : ATR expansion confirmation to ensure signals occur during active market conditions
Market Session Filter : Filters signals to specific trading sessions (Tokyo, London, New York)
ADVANCED FEATURES
🎯 Smart Money Concepts Integration
Order Blocks : Identifies institutional supply/demand zones from major and minor structure breaks
Fair Value Gaps (FVGs) : Detects price imbalances and tracks their evolution through partial fills and inversions
Market Structure : Recognizes Break of Structure (BOS) and Change of Character (CHoCH) patterns
Retracement Patterns : Tracks HLH (Higher-Low-Higher) and LHL (Lower-High-Lower) institutional patterns
📈 Support/Resistance System
Multi-timeframe pivot detection (3, 5, 7-bar spans)
Volume-weighted strength calculation for level importance
Dynamic level merging and break tracking
Automatic level type classification (Support/Resistance/Flip zones)
⚙️ Intelligent Filtering Logic
ALL Mode : Requires all enabled filters to pass (high precision)
ANY Mode : Requires at least one filter to pass (higher frequency)
Real-time filter status tracking and visualization
Visual Features
Signal Markers : Clear triangular markers for qualified momentum bars
Unfiltered Signals : Optional display of raw momentum bars for comparison
Level Visualization : Dynamic S/R level boxes and lines with strength indicators
Structure Lines : BOS/CHoCH break visualization with major/minor classification
Fair Value Gaps : Color-coded boxes showing bullish/bearish FVGs with partial fill tracking and IFVG conversion
Order Blocks : Institutional supply/demand zones displayed as colored boxes with major/minor classification
Information Table : Real-time display of signal details and filter status
Session Boxes : Visual representation of active trading sessions
Practical Applications
✅ Swing Trading : Identify high-probability reversal and continuation setups
✅ Day Trading : Spot intraday momentum shifts with institutional backing
✅ Multi-Timeframe Analysis : Combine major and minor structure analysis
✅ Risk Management : Filter out low-quality setups using confluence requirements
✅ Educational : Understand market structure and institutional order flow
Customization Options
Adjustable momentum thresholds for different market conditions
Comprehensive filter settings with individual enable/disable controls
Visual customization for colors, sizes, and display preferences
Alert system with detailed signal information
Performance optimization settings for different chart timeframes
Who Should Use This Indicator
This indicator is suitable for traders who:
Want to combine multiple technical analysis approaches
Seek to understand institutional market behavior
Prefer confluence-based trading setups
Need customizable filtering for different market conditions
Value comprehensive signal validation over high-frequency alerts
The Momentum Confluence Detector transforms complex market analysis into clear, actionable signals by requiring multiple forms of confirmation before highlighting trading opportunities.
RD-DynamicTSMADescription of the RD-DynamicTSMA Pine Script Indicator:
This single indicator dynamically adjusts the three SMAs to key periods used by professional traders across timeframes:
Daily: 10, 21, 50 periods (standard for swing trading trends).
Weekly+: 10, 21, 30 periods (optimized for positional & longer-term views).
Lengths auto-update on timeframe switches.
Position Size Calculator includes Acct % Risk (Improved)Uses account size to determine position size. Sets the stop at the low of the day for swing trading.
Effort vs Result TRFxThe Effort vs Result (EVR) indicator is designed to identify high-probability reversal signals based on volume and price action dynamics. It highlights points where the market “effort” (high volume) does not correspond to an immediate “result” (price continuation), providing actionable trade setups for both bullish and bearish scenarios.
Features:
Detects bullish EVR signals when a previous high-volume sell candle is followed by a strong bullish candle that sweeps the previous low.
Detects bearish EVR signals when a previous high-volume buy candle is followed by a strong bearish candle that sweeps the previous high.
Sticky arrows plot automatically above or below the candle, ensuring the signal moves with the price bar.
Considers inside bars, wick size, and relative volume to filter low-quality setups.
Fully compatible with multiple timeframes.
Inputs:
Volume Multiplier: Sets how much higher the current candle’s volume should be compared to the previous candle to count as high volume.
Min Wick % of Candle: Minimum wick size relative to the candle body to filter insignificant bars.
Max Inside Bars to Ignore: Number of inside bars between the previous candle and the EVR candle to ignore minor consolidations.
Usage:
(Green Arrow): Enter long when a green arrow appears below the candle. Place stop-loss slightly below the previous swing low.
(Red Arrow): Enter short when a red arrow appears above the candle. Place stop-loss slightly above the previous swing high.
Can be combined with support/resistance levels, trendlines, or other technical indicators for higher accuracy.
Benefits:
Simple and clean visual signals with tiny arrows that move with candles.
Helps traders identify high-probability reversal points based on volume and price action.
Ideal for intraday and swing trading strategies.